

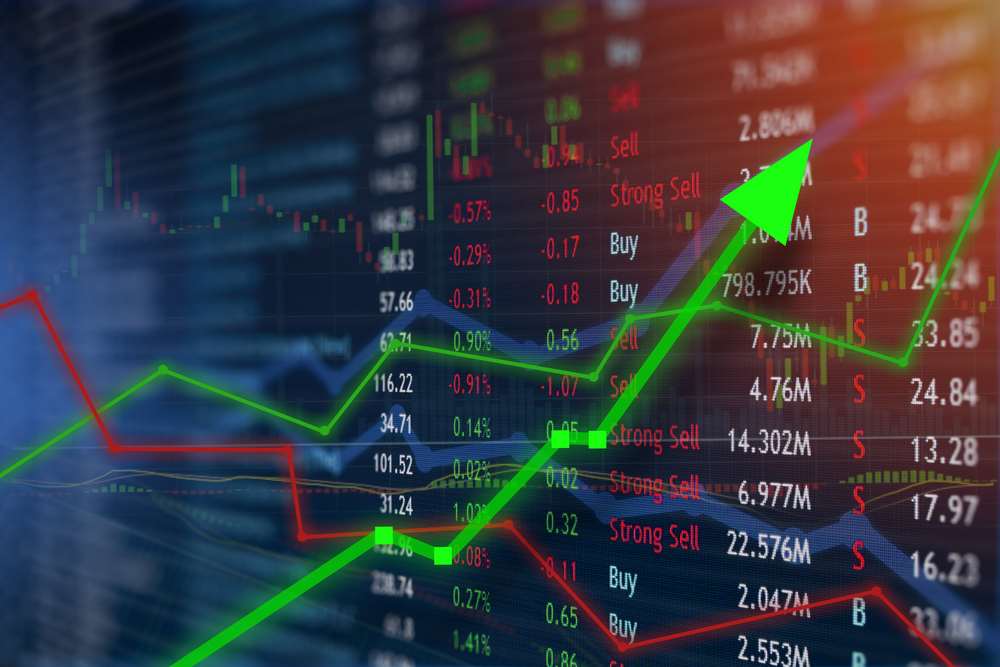
In the ever-evolving world of cryptocurrencies, understanding price movements is akin to deciphering a complex code. The crypto charts, like a mysterious language, hold the key to potential profits. Let’s delve into the intricacies of reading these charts and navigating the volatile waters of the crypto market.
Table of Contents
Crypto Charts for Beginners
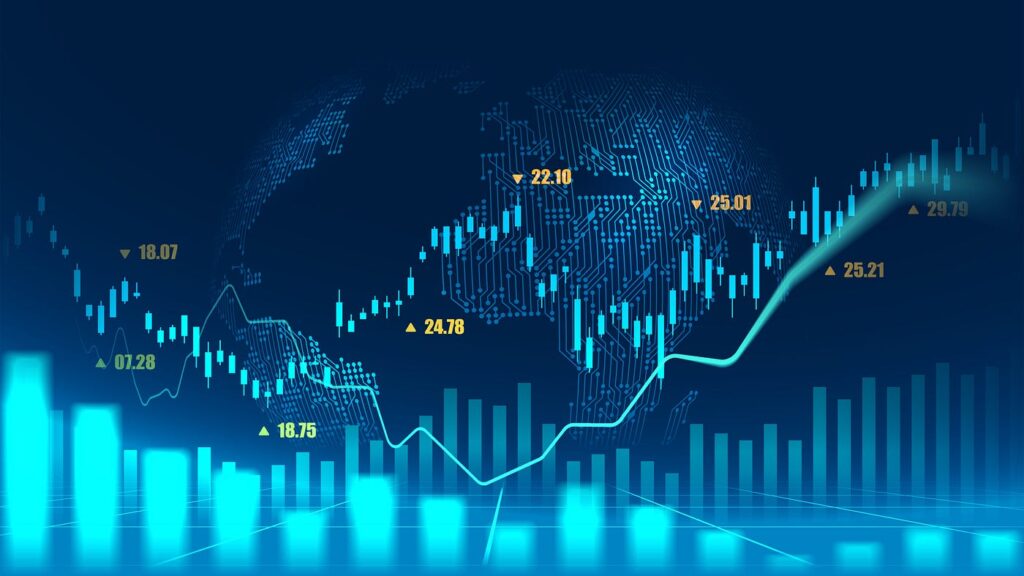
Candlestick Patterns
Navigating through the dynamic crypto landscape begins with grasping the fundamentals. Candlestick patterns, the graphical representation of price movements, provide valuable insights. From the neutrality of dojis to the significance of engulfing patterns, each formation tells a unique tale about market sentiment. Recognizing and interpreting these patterns empowers beginners to make informed trading decisions.
Riding the Waves: Trend Analysis
For a seasoned crypto investor, riding the waves is a skill honed through trend analysis. Identifying the prevailing direction in which an asset’s price is moving is crucial. Whether it’s an upward bullish trend signaling potential growth or a downward bearish trend indicating a potential decline, recognizing and capitalizing on these trends can be the key to successful trading. By aligning with the broader market direction, investors position themselves strategically for profitable ventures.
Tools of the Trade: Indicators and Oscillators
Moving Averages: Unveiling Trends
In the quest for profitable crypto ventures, understanding moving averages is crucial. These indicators, be it a simple moving average (SMA) or an exponential moving average (EMA), smooth out price data, unveiling underlying trends. A rising moving average may indicate an uptrend, while a falling one may signify a downtrend. By incorporating these tools into your analysis, you gain a clearer picture of market trends, aiding in timely decision-making.
RSI and MACD: Gauging Momentum
To truly master crypto chart reading, acquaint yourself with the Relative Strength Index (RSI) and Moving Average Convergence Divergence (MACD). RSI gauges the momentum by assessing the speed and change of price movements, indicating overbought or oversold conditions. On the other hand, MACD provides insights into the relationship between two moving averages, helping identify potential trend reversals or continuations. A balanced integration of RSI and MACD can serve as a guiding force in formulating a strategic and informed trading approach.
Risk Management
Setting Limits: Stop-Loss and Take-Profit
Successful crypto traders understand the paramount importance of risk management. Setting limits through stop-loss and take-profit orders is akin to navigating the market with a safety net. By defining exit points in advance, traders can mitigate potential losses and secure profits, ensuring a disciplined and methodical approach to trading. This proactive strategy safeguards against unforeseen market fluctuations.
Diversification: The Shield Against Volatility
Diversifying your crypto portfolio is the ultimate shield against market volatility. Spreading investments across different assets minimizes risks, providing a more robust defense against sudden market fluctuations. A well-diversified portfolio not only safeguards your investments but also enhances the potential for overall returns. By allocating assets strategically, investors can weather the storms of volatility and emerge resilient in the dynamic crypto landscape.
Final Words
Reading crypto charts is not just a skill; it’s an art. By embracing the basics, utilizing tools, and crafting a strategic approach, one can navigate the crypto market with confidence. Remember, in this dynamic landscape, staying informed and adapting to changes is the key to unlocking the potential of cryptocurrency investments.